Table of Contents
How To Create Amazing Infographics With DesignCap Without Having Any Experience
Create Infographics with DesignCap. This post is an easy to follow tutorial on how to use DesignCap for making infographics.
Infographics are an incredible way of sharing information, attracting attention, and keeping users connected to your content. But creating infographics can be challenging for marketers and small businesses.
Many details need to be incorporated into an infographic, and the amount of time required to do them from scratch can become an impediment.
DesignCap Infographic Maker is designed to facilitate this, which will make creating infographics a lot easier. It offers a variety of customizable infographic templates. Besides, it provides many other design templates that you can use for your visual content marketing.
In this article, I’ll describe the steps you need to follow to create an infographic with DesignCap.
What is DesignCap?

DesignCap is an online tool that allows you to create various visual graphics, such as infographics, reports, presentations, images for social banners, and much more.
With DesignCap, it is possible to save projects for further editing and generate a shareable URL of the infographic. In addition to the download options in KPG, PNG, PDF, and PPTX in presentation mode.
You can make compelling visuals and Infographics without knowing the basics of designing by using DesignCap Share on XWhen you enter the app, you will have access to thousands of templates created by specialists and modifiable with just a few clicks, in addition to many options to convey all your personality to your work.
How To Create Infographics With DesignCap
Now that you know the type of infographic templates offered by DesignCap, you can choose the one that best fits you and start personalizing it. Below are the steps of how to creating a fantastic infographic.
infographics With DesignCap A Step By Step Tutorial
Step 1: Outline the whole design

If you want to start the design from scratch, pick a theme, and outline your infographic design to make it readable. In addition to the main title that describes the story of the infographic, you may have subtitles and section dividers. These titles, subtitles, and section dividers need to be outlined well in your mind before starting your design.
Instead, if you don’t have any idea in mind, you’d better pick a template that fits your needs from a large number of preset ones. And then change the text and images.
Step 2: Use statistical data

Whether you have a data-driven sketch or not, you need to consider how to incorporate the numbers in your infographic. Data of any kind will facilitate the absorption of information and improve the understanding of the subject.
But you may have more complex data at hand. In that case, you need to choose charts that best share your information – DesignCap has a list of chart types that you can use. You can use pie, area, map, bar, column, and other charts to explain a variety of information in a single visual design.
Remember not to be too diverse in using the chart, although there are many options if you can light separate sets of data using a similar chart. It can be fun to play with many tools, but it doesn’t always look good on the final design. After all, your infographic needs to be legible and cohesive for your audience. So I use some of them to make my infographic.
Step 3: Choose your icons
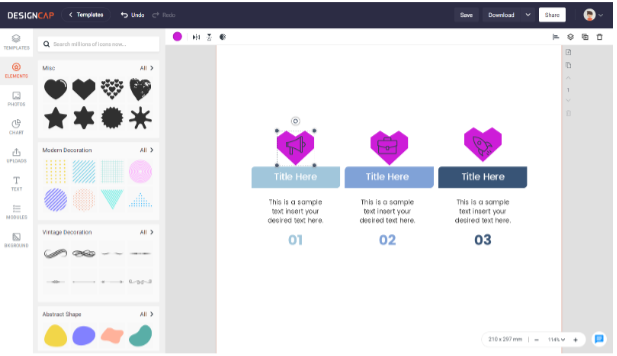
Icons are an excellent graphic resource that evokes emotions and tells a story that is usually much better than a paragraph of only text.
Make graphic design much easier With DesignCap. A tutorial via #pvariel Share on XYou already have an outline for your infographic and the data you want to highlight in it. Why not use some icons to draw attention to the information you are highlighting?
When working on your infographic template, use icons that enhance the story you’re telling through your visuals. You can use the replacement tool in DesignCap to exchange one image for another in the same location. DesignCap offers millions of icons in its app. Just search one and click on the icon to add it to the canvas. Or use the preset shapes.
Step 4: Customize with other elements
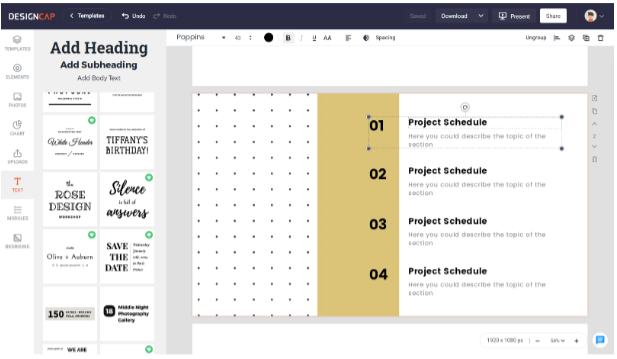
After including the data, figures, and icons needed, you may customize your design with your brand needs. Branding is an essential component in visual content marketing for small businesses, so you can add your brand fonts, colors, and logos into the design.
Besides, you can add text and background to make your design more attractive. You are allowed to change the colors in your visuals and the fonts in your infographic manually using the text tools.
If you have more or less information want to show in the template, you can add more block or delete something to accommodate additional elements or fewer elements. Customizing the infographic will make it look like your brand look, not a template, which will make it more attractive to your target audience.
Step 5: Save and share
Before publishing your infographic, you should take another look at it.
Are your icons aligned?
Have all data points been covered? Are your sources consistent?
Checking your infographic will ensure that everything is in place and intact for you to share it with the world.
Once everything looks great, save it under your account or share it anywhere you want.
Conclusion

Infographic design is a great way to visualize your content and attract more readers online. With the above guide and indicators on how to make infographics with DesignCap, you’ll create compelling visuals to tell your brand’s story effectively. So, start building your infographics and use them on your websites and blogs.
PS: Check The Comment Box Below To Read More Mentions (Pingbacks) About This Post.
Dear Readers, Your Attention Please!
In short, Philipscom will not approve comments that
Check your domain ranking
Thanks for your post I am a newbie when creating infographic but with the help of your post I think I am on the next step of becoming a professional.The post was helpful to me thanks ones again.
Thanks for giving this information, these information is very useful. It’s really interesting to note the wonderful meaning of the word Hack.
Thanks for introducing Design cap to me. Is it free ? For infographics designing i have been using many online free available tools. And now i am excited to try Design Cap also.
[…] design while sharing information in an easily digestible way. If you want to try this strategy, check out the tools and tips in this Philipscom post by Philip Verghese Ariel. Then see what members of the […]
[…] design while sharing information in an easily digestible way. If you want to try this strategy, check out the tools and tips in this Philipscom post by Philip Verghese Ariel. Then see what members of the […]
[…] design while sharing information in an easily digestible way. If you want to try this strategy, check out the tools and tips in this Philipscom post by Philip Verghese Ariel. Then see what members of the […]
[…] design while sharing information in an easily digestible way. If you want to try this strategy, check out the tools and tips in this Philipscom post by Philip Verghese Ariel. Then see what members of the […]
[…] design while sharing information in an easily digestible way. If you want to try this strategy, check out the tools and tips in this Philipscom post by Philip Verghese Ariel. Then see what members of the […]
[…] design while sharing information in an easily digestible way. If you want to try this strategy, check out the tools and tips in this Philipscom post by Philip Verghese Ariel. Then see what members of the […]
[…] design while sharing information in an easily digestible way. If you want to try this strategy, check out the tools and tips in this Philipscom post by Philip Verghese Ariel. Then see what members of the […]
[…] design while sharing information in an easily digestible way. If you want to try this strategy, check out the tools and tips in this Philipscom post by Philip Verghese Ariel. Then see what members of the […]
[…] design while sharing information in an easily digestible way. If you want to try this strategy, check out the tools and tips in this Philipscom post by Philip Verghese Ariel. Then see what members of the […]
[…] mientras comparte información de una manera fácil de digerir. Si quieres probar esta estrategia, revisa las herramientas y consejos en esta publicación de Philipscom por Philip Verghese Ariel. Luego vea […]
[…] design while sharing information in an easily digestible way. If you want to try this strategy, check out the tools and tips in this Philipscom post by Philip Verghese Ariel. Then see what members of the […]
[…] design while sharing information in an easily digestible way. If you want to try this strategy, check out the tools and tips in this Philipscom post by Philip Verghese Ariel. Then see what members of the […]
[…] design while sharing information in an easily digestible way. If you want to try this strategy, check out the tools and tips in this Philipscom post by Philip Verghese Ariel. Then see what members of the […]
[…] design while sharing information in an easily digestible way. If you want to try this strategy, check out the tools and tips in this Philipscom post by Philip Verghese Ariel. Then see what members of the […]
[…] design while sharing information in an easily digestible way. If you want to try this strategy, check out the tools and tips in this Philipscom post by Philip Verghese Ariel. Then see what members of the […]
[…] design while sharing information in an easily digestible way. If you want to try this strategy, check out the tools and tips in this Philipscom post by Philip Verghese Ariel. Then see what members of the […]
[…] design while sharing information in an easily digestible way. If you want to try this strategy, check out the tools and tips in this Philipscom post by Philip Verghese Ariel. Then see what members of the […]
[…] design while sharing information in an easily digestible way. If you want to try this strategy, check out the tools and tips in this Philipscom post by Philip Verghese Ariel. Then see what members of the […]
[…] mientras comparte información de una manera fácil de digerir. Si quieres probar esta estrategia, verificar las herramientas y los consejos en esta publicación de Philipscom de Philip Verghese Ariel. Luego […]
[…] while sharing information in an easily digestible way. If you want to try this strategy, check out the tools and tips in this Philipscom post by Philip Verghese Ariel. Then see what members of […]
[…] informatie op een gemakkelijk verteerbare manier verstrekken. Als je deze strategie wilt proberen, uitchecken tools en tips in dit bericht Philipscom door Philip Verghese Ariel. Kijk dan wat leden van de […]